How to deploy an EFK stack to Kubernetes
EFK stack? Like ELK?
You may have heard of ELK (Elasticsearch, Logstash, Kibana). EFK is the same stack where we replace Logstash by Fluentd. So why replace Logstash with Fluentd?
First of all, Fluentd is now hosted by the Cloud Native Computing Foundation, the same which hosts Kubernetes. Also, I find it very easy to configure, there is a lot of plugins and its memory footprint is very low.
We could also replace Fluentd by Fluent Bit, which is a lighter log forwarder but has fewer functionalities than the first one.
How does it work
A picture is worth a thousand words, so here is a simple schema.
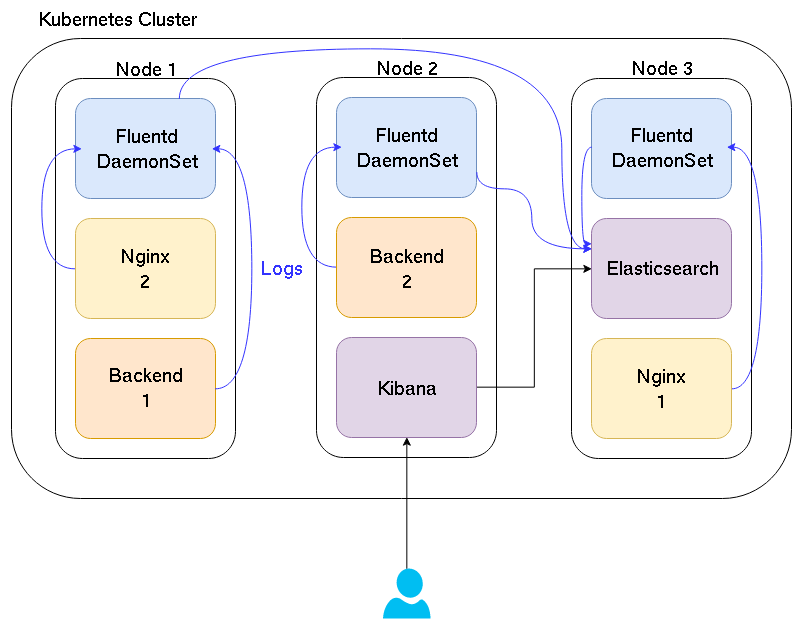
Basically, each Fluentd container reads the /var/lib/docker to get the logs of each container on the node and send them to Elasticsearch. Finally, when we access Kibana, it requests the logs from Elasticsearch.
What for?
You may ask yourselves why bother setting up such a stack? I can just run docker logs ..., and there I have my logs.
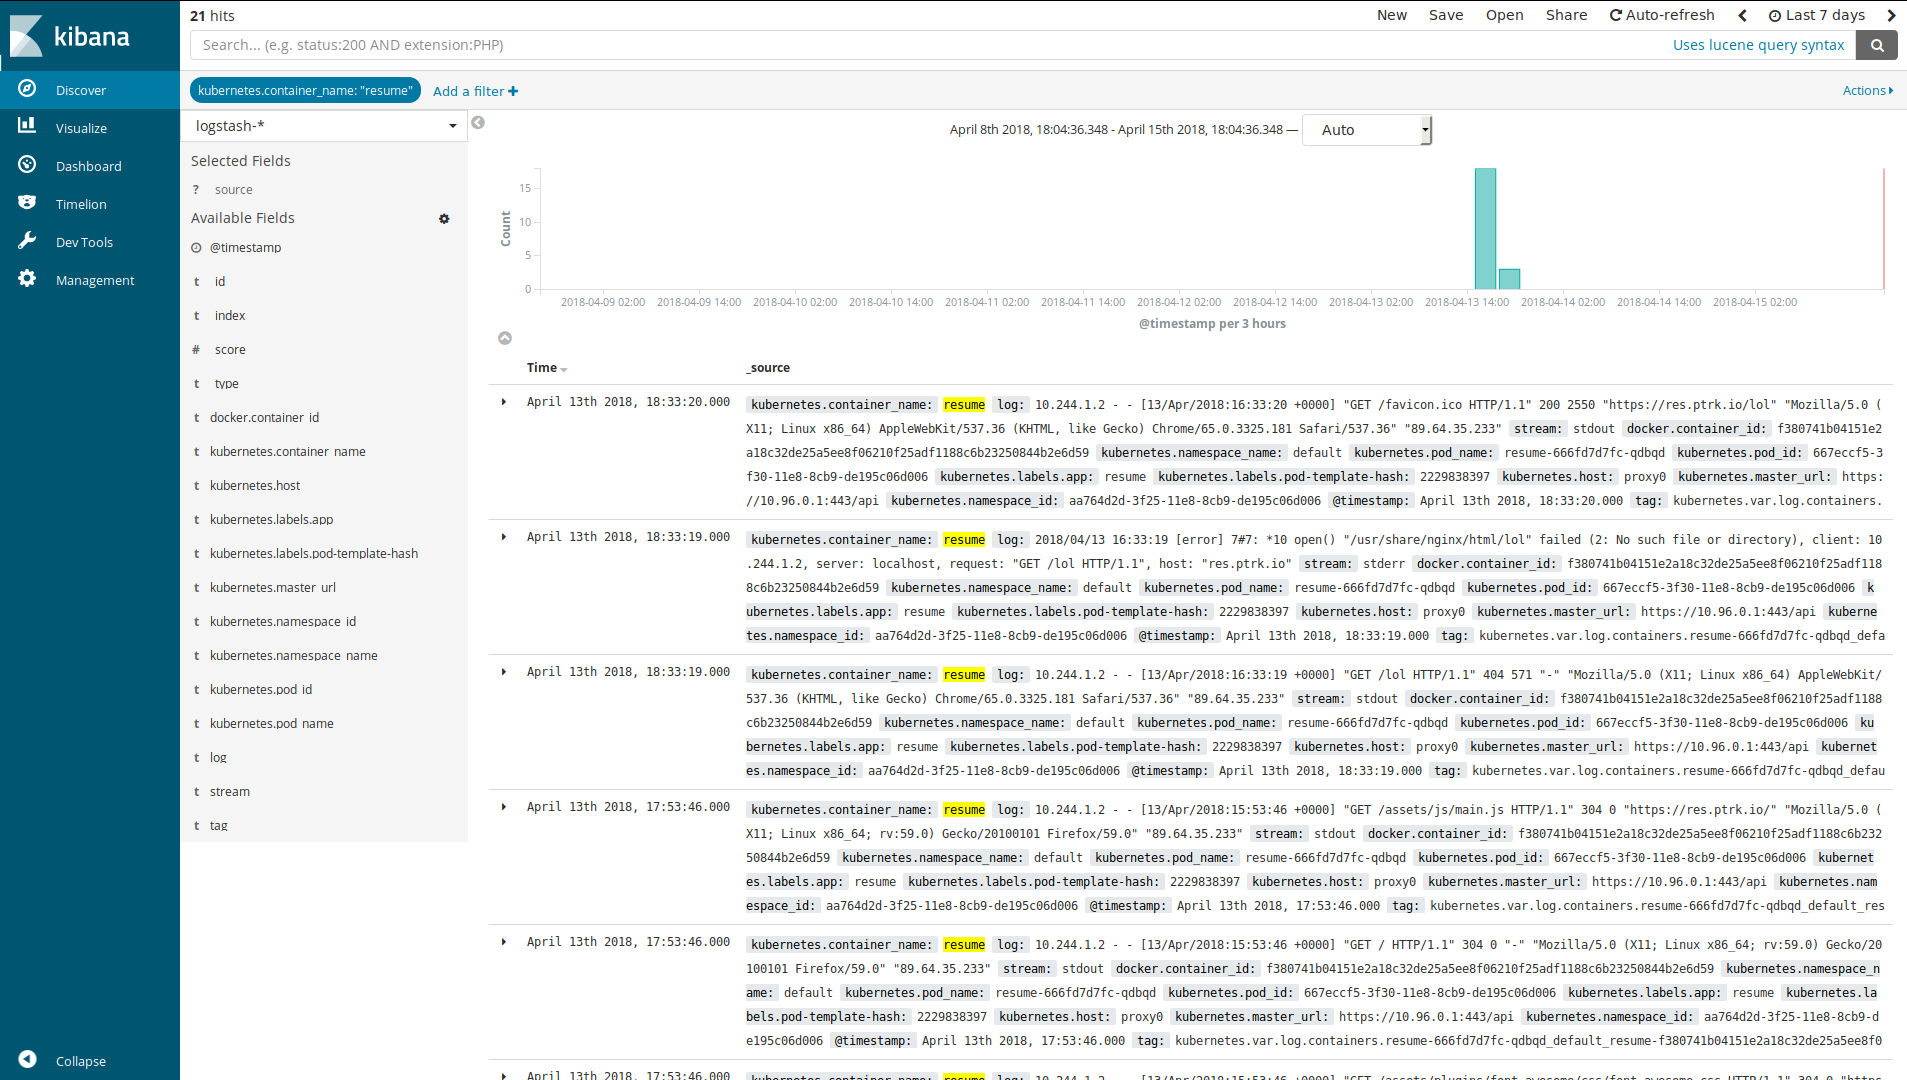
Well, yes, you could. However, if you have several replicas you’ll have to go through each one of the containers to find what you are looking for. Here you can go through all the logs at once. Also, with Kibana you can create dashboards and very nice visualizations.
Take a look:

From elastic.co
Another interesting point is the manipulation of the logs. With Fluentd you can filter, modify and backup your logs very easily. But we’ll look into that in another post.
Enough with the introduction, let’s build this stack!
Elasticsearch
Elasticsearch is a distributed, RESTful search and analytics engine capable of solving a growing number of use cases. As the heart of the Elastic Stack, it centrally stores your data so you can discover the expected and uncover the unexpected.
In the E*K stack, we use Elasticsearch to store and search the logs forwarded by Fluentd. To deploy it into our Kubernetes cluster, we can use the GitHub repository of pires: pires/kubernetes-elasticsearch-cluster
You can modify the values in es-master.yaml, es-client.yaml and in es-data.yaml, for changing the number of replicas, the names, etc.
By default,
ES_JAVA_OPTSis set to-Xms256m -Xmx256m. This is a very low value but many users, i.e. minikube users, were having issues with pods getting killed because hosts were out of memory. One can change this in the deployment descriptors available in this repository. README.md
It is also recommended to change the storage from emptyDir to the storage of your choosing to get persistent storage of the data.
Once you have setup your files you can run:
$ kubectl -n logging create -f es-discovery-svc.yaml
$ kubectl -n logging create -f es-svc.yaml
$ kubectl -n logging create -f es-master.yaml
$ kubectl -n logging rollout status -f es-master.yaml
$ kubectl -n logging create -f es-client.yaml
$ kubectl -n logging rollout status -f es-client.yaml
$ kubectl -n logging create -f es-data.yaml
$ kubectl -n logging rollout status -f es-data.yaml
Note: I will run the EFK stack in the
loggingnamespace, usekubectl create ns loggingto create it.
Check that your Elasticsearch is up and running by following pires instructions.
If everything is okay, we can now set up Fluentd (or Fluent Bit)!
Fluentd
Fluentd is an open source data collector, which lets you unify the data collection and consumption for a better use and understanding of data. https://www.fluentd.org/architecture
Fluentd can be run directly on the host, or in a Docker container. Here we will use a DaemonSet to ensure that Fluentd is running on every node. The code is from fluent/fluentd-kubernetes-daemonset.
If you have RBAC enabled on your cluster (and I hope you have), check the ClusterRole, ClusterRoleBinding and ServiceAccount of fluentd-daemonset-elasticsearch-rbac.yaml.
Don’t forget to change the namespace to the one used when deploying Elasticsearch, it should be the same.
Then we can apply the DaemonSet:
apiVersion: apps/v1
kind: DaemonSet
metadata:
  name: fluentd
  namespace: logging
  labels:
    component: fluentd-logging
    version: v1
    kubernetes.io/cluster-service: "true"
spec:
  selector:
    matchLabels:
      component: fluentd-logging
  template:
    metadata:
      labels:
        component: fluentd-logging
        version: v1
        kubernetes.io/cluster-service: "true"
    spec:
      serviceAccount: fluentd # if you have RBAC enabled
      serviceAccountName: fluentd # if you have RBAC enabled
      tolerations:
      - key: node-role.kubernetes.io/master
        effect: NoSchedule
      containers:
      - name: fluentd
        image: fluent/fluentd-kubernetes-daemonset:elasticsearch
        env:
          - name:  FLUENT_ELASTICSEARCH_HOST
            value: "elasticsearch" # the name of the previous es-svc.yml
          - name:  FLUENT_ELASTICSEARCH_PORT
            value: "9200" # port of the previous es-svc.yml
          - name: FLUENT_ELASTICSEARCH_SCHEME
            value: "http"
        resources:
          limits:
            memory: 200Mi
          requests:
            cpu: 100m
            memory: 200Mi
        volumeMounts:
        - name: varlog
          mountPath: /var/log
        - name: varlibdockercontainers
          mountPath: /var/lib/docker/containers
          readOnly: true
      terminationGracePeriodSeconds: 30
      volumes:
      - name: varlog
        hostPath:
          path: /var/log
      - name: varlibdockercontainers
        hostPath:
          path: /var/lib/docker/containers
Fluent Bit
We will use the code of fluent/fluent-bit-kubernetes-logging.
As for Fluentd, if you use RBAC, create the ClusterRole, ClusterRoleBinding and ServiceAccount with:
$ kubectl create -f https://raw.githubusercontent.com/fluent/fluent-bit-kubernetes-logging/master/fluent-bit-service-account.yaml
$ kubectl create -f https://raw.githubusercontent.com/fluent/fluent-bit-kubernetes-logging/master/fluent-bit-role.yaml
$ kubectl create -f https://raw.githubusercontent.com/fluent/fluent-bit-kubernetes-logging/master/fluent-bit-role-binding.yaml
We also need to create a ConfigMap for the configuration. You can either modify this one and apply it or use the default one:
$ kubectl create -f https://raw.githubusercontent.com/fluent/fluent-bit-kubernetes-logging/master/output/elasticsearch/fluent-bit-configmap.yaml
Once the ConfigMap is applied, here is the code for the DaemonSet:
apiVersion: apps/v1
kind: DaemonSet
metadata:
  name: fluent-bit
  namespace: logging
  labels:
    component: fluent-bit-logging
    version: v1
    kubernetes.io/cluster-service: "true"
spec:
  selector:
    matchLabels:
      component: fluent-bit-logging
  template:
    metadata:
      labels:
        component: fluent-bit-logging
        version: v1
        kubernetes.io/cluster-service: "true"
    spec:
      containers:
      - name: fluent-bit
        image: fluent/fluent-bit:0.12.17
        env:
        - name: FLUENT_ELASTICSEARCH_HOST
          value: "elasticsearch" # the name of the previous es-svc.yml
        - name: FLUENT_ELASTICSEARCH_PORT
          value: "9200" # the port of the previous es-svc.yml
        volumeMounts:
        - name: varlog
          mountPath: /var/log
        - name: varlibdockercontainers
          mountPath: /var/lib/docker/containers
          readOnly: true
        - name: fluent-bit-config
          mountPath: /fluent-bit/etc/
      terminationGracePeriodSeconds: 10
      volumes:
      - name: varlog
        hostPath:
          path: /var/log
      - name: varlibdockercontainers
        hostPath:
          path: /var/lib/docker/containers
      - name: fluent-bit-config
        configMap:
          name: fluent-bit-config # name of the previously created ConfigMap
      serviceAccountName: fluent-bit
      tolerations:
      - key: node-role.kubernetes.io/master
        operator: Exists
        effect: NoSchedule
Kibana
Once you have some logs into Elasticsearch, we can add a tool for exploring and analyze them like Kibana.
Kibana lets you visualize your Elasticsearch data and navigate the Elastic Stack.
So we will deploy Kibana as a deployment. We’ll use the 6.2 OSS version because it does not have X-Pack enabled. (If you want X-Pack, you can, of course, adjust the image name).
apiVersion: apps/v1
kind: Deployment
metadata:
  namespace: logging
  name: kibana
  labels:
    component: kibana
spec:
  replicas: 1
  selector:
    matchLabels:
     component: kibana
  template:
    metadata:
      labels:
        component: kibana
    spec:
      containers:
      - name: kibana
        image: docker.elastic.co/kibana/kibana-oss:6.2.2
        env:
        - name: CLUSTER_NAME
          value: myesdb # name of the Elasticsearch cluster defined in the first part
        resources:
          limits:
            cpu: 1000m
          requests:
            cpu: 100m
        ports:
        - containerPort: 5601
          name: http
When the pod is up and running, we can make it accessible via a Service and an Ingress:
apiVersion: v1
kind: Service
metadata:
  namespace: logging
  name: kibana
  labels:
    component: kibana
spec:
  selector:
    component: kibana
  ports:
  - name: http
    port: 5601
---
apiVersion: extensions/v1beta1
kind: Ingress
metadata:
    namespace: logging
    name: kibana
    annotations:
        kubernetes.io/ingress.class: traefik
        ingress.kubernetes.io/auth-type: "basic"
        ingress.kubernetes.io/auth-secret: kibana-basic-auth
spec:
    rules:
      - host: "<your-url>"
        http:
            paths:
                - path: /
                  backend:
                      serviceName: kibana
                      servicePort: http
For protecting Kibana with a user/password, we will use Traefik as an Ingress controller. To create the secret:
$ htpasswd -c ./auth <your-user>
$ kubectl -n logging create secret generic kibana-basic-auth --from-file auth
$ rm auth
When you will access to Kibana for the first time, you need to configure your first index.
If you did not change Fluentd’s default configuration, the index name/pattern is logstash-YYYY-MM-DD. You can use a wildcard to catch all index beginning with logstash- by using logstash-*.
And now you have a functional EFK stack!
In the next part, we will dive into the configuration of Fluentd and Kibana.
Thanks to @jmaitrehenry for his feedback on this post.
kubernetes k8s efk elasticsearch fluentd kibana
1267 Words
2018-04-18 00:00 (Last updated: 2021-05-02 20:49)
a5cb94c @ 2021-05-02