7 minutes
Tweaking an EFK stack on Kubernetes
This is the continuation of my last post regarding EFK on Kubernetes. In this post we will mainly focus on configuring Fluentd/Fluent Bit but there will also be a Kibana tweak with the Logtrail plugin.
Configuring Fluentd
This part and the next one will have the same goal but one will focus on Fluentd and the other on Fluent Bit. Our goal is to create a configuration that will separate the logs of different namespaces and select which containers we want to log depending on their label.
Configure the DaemonSet
The first thing we need to do is change Fluentd’s DaemonSet. In fact, if we use the one provided by Fluentd, the configuration file is hardcoded into the image and it is not very simple to change it. So we will create a Kubernetes ConfigMap and mount it in the /fluentd/etc folder. If you have RBAC enabled, and you should, don’t forget to configure it for Fluentd:
# fluentd-rbac.yml
# If you have RBAC enabled
apiVersion: v1
kind: ServiceAccount
metadata:
  name: fluentd
  namespace: kube-system
---
apiVersion: rbac.authorization.k8s.io/v1beta1
kind: ClusterRole
metadata:
  name: fluentd
  namespace: kube-system
rules:
- apiGroups:
  - ""
  resources:
  - pods
  - namespaces
  verbs:
  - get
  - list
  - watch
---
kind: ClusterRoleBinding
apiVersion: rbac.authorization.k8s.io/v1beta1
metadata:
  name: fluentd
roleRef:
  kind: ClusterRole
  name: fluentd
  apiGroup: rbac.authorization.k8s.io
subjects:
- kind: ServiceAccount
  name: fluentd
  namespace: kube-system
Now regarding the DaemonSet:
# fluentd-daemonset.yml
apiVersion: extensions/v1beta1
kind: DaemonSet
metadata:
  name: fluentd
  labels:
    k8s-app: fluentd-logging
    version: v1
    kubernetes.io/cluster-service: "true"
spec:
  template:
    metadata:
      labels:
        k8s-app: fluentd-logging
        version: v1
        kubernetes.io/cluster-service: "true"
    spec:
      serviceAccount: fluentd # if RBAC is enabled
      serviceAccountName: fluentd # if RBAC is enabled
      tolerations:
      - key: node-role.kubernetes.io/master
        effect: NoSchedule
      containers:
      - name: fluentd
        image: fluent/fluentd-kubernetes-daemonset:v1.1-debian-elasticsearch
        env:
        - name:  FLUENT_ELASTICSEARCH_HOST
          value: "elasticsearch"
        - name:  FLUENT_ELASTICSEARCH_PORT
          value: "9200"
        - name: FLUENT_ELASTICSEARCH_SCHEME
          value: "http"
        - name: FLUENT_ELASTICSEARCH_USER # even if not used they are necessary
          value: "foo"
        - name: FLUENT_ELASTICSEARCH_PASSWORD # even if not used they are necessary
          value: "bar"
        resources:
          limits:
            memory: 200Mi
          requests:
            cpu: 100m
            memory: 200Mi
        volumeMounts:
        - name: varlog
          mountPath: /var/log
        - name: varlibdockercontainers
          mountPath: /var/lib/docker/containers
          readOnly: true
        - name: fluentd-config
          mountPath: /fluentd/etc # path of fluentd config file
      terminationGracePeriodSeconds: 30
      volumes:
      - name: varlog
        hostPath:
          path: /var/log
      - name: varlibdockercontainers
        hostPath:
          path: /var/lib/docker/containers
      - name: fluentd-config
        configMap:
          name: fluentd-config # name of the config map we will create
Note that we are using Fluentd v1. Some configurations will not work on v0.12!
You may wonder why I added FLUENT_ELASTICSEARCH_PASSWORD and FLUENT_ELASTICSEARCH_USER. It is because the Docker image fluent/fluentd-kubernetes-daemonset uses sed on the configuration file if these environment variables are not set, and since the ConfigMap is read-only the container will fail to start. We could change the base image of the DaemonSet but adding these two lines is simpler and doesn’t hurt.
With the DaemonSet created we can now focus on our fluentd-config ConfigMap.
Creating the ConfigMap
Here is a basic Fluentd configuration for Kubernetes (You can learn more on configuring Fluentd in their documentation):
# fluentd-config-map.yml
apiVersion: v1
kind: ConfigMap
metadata:
  name: fluentd-config
data:
  fluent.conf: |
    <match fluent.**>
        # this tells fluentd to not output its log on stdout
        @type null
    </match>

    # here we read the logs from Docker's containers and parse them
    <source>
      @type tail
      path /var/log/containers/*.log
      pos_file /var/log/fluentd-containers.log.pos
      tag kubernetes.*
      read_from_head true
      <parse>
        @type json
        time_format %Y-%m-%dT%H:%M:%S.%NZ
      </parse>
    </source>

    # we use kubernetes metadata plugin to add metadatas to the log
    <filter kubernetes.**>
        @type kubernetes_metadata
    </filter>

    # we send the logs to Elasticsearch
    <match kubernetes.**>
        @type elasticsearch
        include_tag_key true
        host "#{ENV['FLUENT_ELASTICSEARCH_HOST']}"
        port "#{ENV['FLUENT_ELASTICSEARCH_PORT']}"
        scheme "#{ENV['FLUENT_ELASTICSEARCH_SCHEME'] || 'http'}"
        ssl_verify "#{ENV['FLUENT_ELASTICSEARCH_SSL_VERIFY'] || 'true'}"
        user "#{ENV['FLUENT_ELASTICSEARCH_USER']}" # remove these lines if not needed
        password "#{ENV['FLUENT_ELASTICSEARCH_PASSWORD']}" # remove these lines if not needed
        reload_connections true
        logstash_prefix logstash
        logstash_format true
        <buffer>
            flush_thread_count 8
            flush_interval 5s
            chunk_limit_size 2M
            queue_limit_length 32
            retry_max_interval 30
            retry_forever true
        </buffer>
    </match>
The Kubernetes metadata plugin is already installed in the Docker image we use.
This configuration does about the same as the one provided by Fluentd. Now if you want for instance to not send the kube-system containers’ logs, you can add these lines before the Elasticsearch output:
<match kubernetes.var.log.containers.**kube-system**.log>
    @type null
</match>
Split the logs regarding to the namespaces
Let’s assume you want to separate your logs depending on the container’s namespace. For instance you could send the logs from the dev namespace to one Elasticsearch cluster and the logs from the production namespace to another one. In order to achieve it we will use the rewrite tag filter. After the metadata plugin, we could add:
# this add the namespace name at the begining of the tag
<match kubernetes.**>
    @type rewrite_tag_filter
    <rule>
        key $['kubernetes']['namespace_name']
        pattern ^(.+)$
        tag $1.${tag}
    </rule>
</match>
And then we could have something like that for the output:
# match the dev logs
<match dev.kubernetes.**>
    @type elasticsearch
    include_tag_key true
    host "#{ENV['FLUENT_ELASTICSEARCH_HOST_DEV']}"
    port "#{ENV['FLUENT_ELASTICSEARCH_PORT_DEV']}"
    scheme "#{ENV['FLUENT_ELASTICSEARCH_SCHEME_DEV'] || 'http'}"
    ...
</match>
# match the production logs
<match production.kubernetes.**>
    @type elasticsearch
    include_tag_key true
    host "#{ENV['FLUENT_ELASTICSEARCH_HOST_PROD']}"
    port "#{ENV['FLUENT_ELASTICSEARCH_PORT_PROD']}"
    scheme "#{ENV['FLUENT_ELASTICSEARCH_SCHEME_PROD'] || 'http'}"
    ...
</match>
It’s just an example, let your imagination make the better of it :) !
Select which containers you want to log
Now we want to select which containers we want to log or which not to log. It is possible with the grep filter (This will only work on Fluentd v1 since nested keys does not seem to work on v0.12).
The idea here is to add a label to the containers you want to log or to the ones you don’t want to log. There is two approaches: either we label all the containers we want to log; or the ones that we don’t want to log.
For instance if we add fluentd: "true" as a label for the containers we want to log we then need to add:
<filter kubernetes.**>
    @type grep
    <regexp>
        key $.kubernetes.labels.fluentd
        pattern true
    </regexp>
</filter>
Or similarly, if we add fluentd: "false" as a label for the containers we don’t want to log we would add:
<filter kubernetes.**>
    @type grep
    <exclude>
        key $.kubernetes.labels.fluentd
        pattern false
    </exclude>
</filter>
And that’s it for Fluentd configuration. Again if you want some more configuration options, check the documentation of Fluentd and of the plugins we used.
Configuring Fluent Bit
Unfortunately configuring Fluent Bit to work just like we just did for Fluentd is not (yet?) possible. One way to achieve it would be to connect Fluent Bit to a Fluentd aggregator but I will not cover it here. You can find some information about it on the fluent Github repo.
Let’s tweak Kibana a bit with the Logtrail plugin
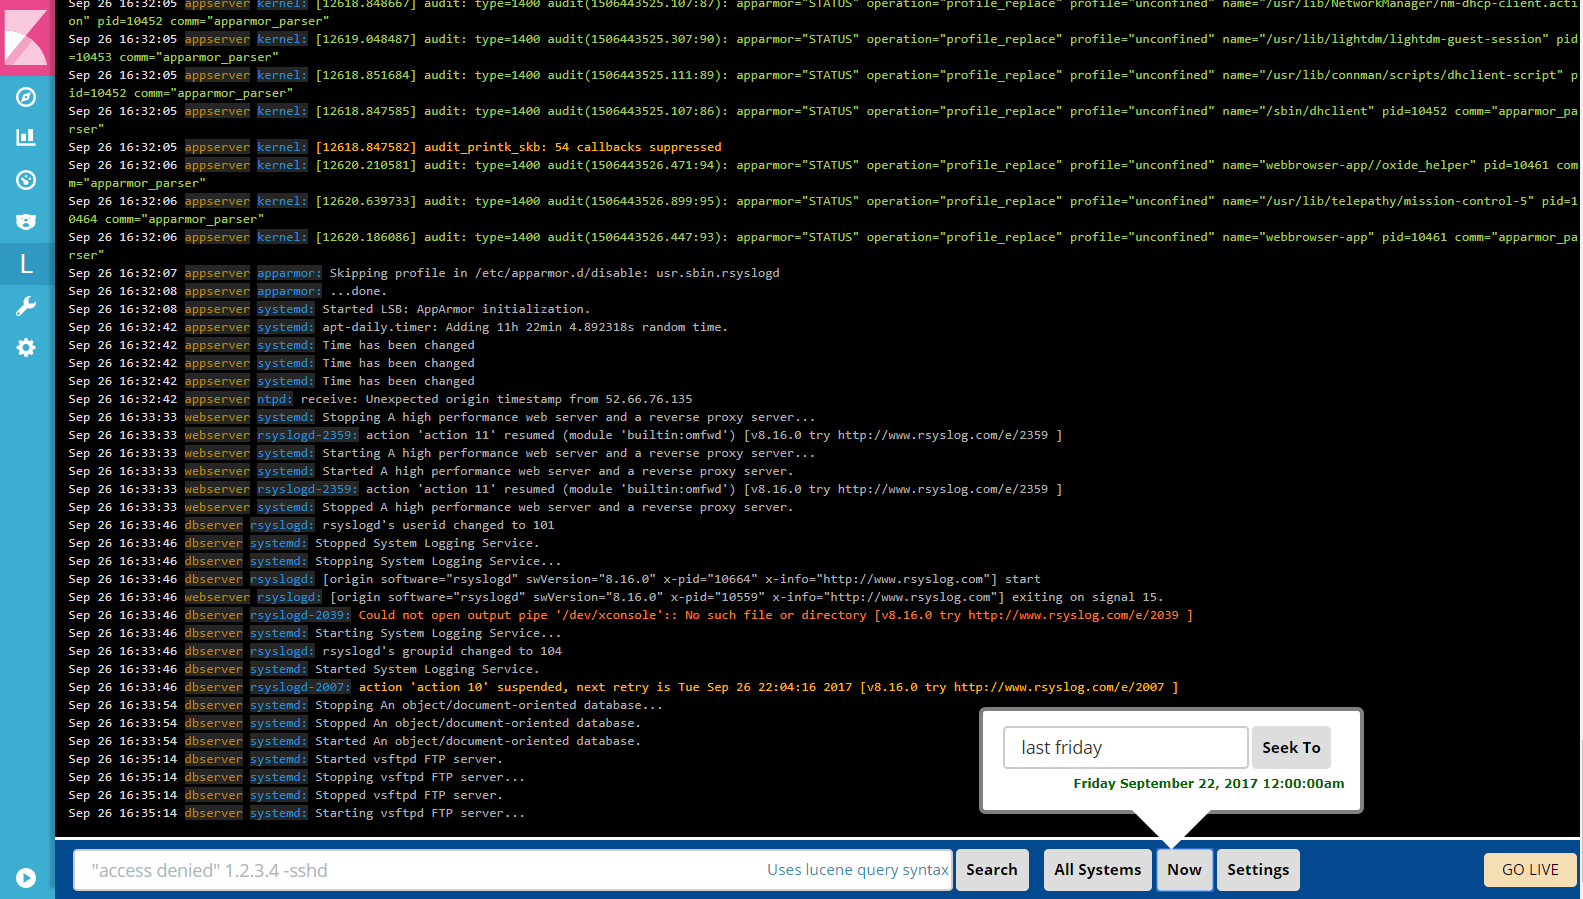
Logtrail is a plugin for Kibana to view, analyze, search and tail log events from multiple hosts in realtime with devops friendly interface inspired by Papertrail.
First we need to install the plugin (Kibana 5.X & 6.X only). To install the plugin you’ll need the URL of a Logtrail release. You can check them here.
You must take the URL corresponding to your Kibana version.
Now, you can build the image with the Logtrail plugin like this (assuming you want Kibana 6.2.4):
FROM docker.elastic.co/kibana/kibana-oss:6.2.4
RUN kibana-plugin install https://github.com/sivasamyk/logtrail/releases/download/v0.1.27/logtrail-6.2.4-0.1.27.zip
WORKDIR /config
USER root
RUN mv /usr/share/kibana/plugins/logtrail/logtrail.json /config/logtrail.json && \
    ln -s /config/logtrail.json /usr/share/kibana/plugins/logtrail/logtrail.json
USER kibana
Or pull the image from my Dockerhub: sh4d1/kibana-logtrail
I only have the
6.2.4tag.
Next step is to configure Logtrail and we will use a ConfigMap. Here is the ConfigMap and the Deployment for Kibana:
apiVersion: v1
kind: ConfigMap
metadata:
  name: logtrail-config
data:
  logtrail.json: |
    {
        "version" : 1,
        "index_patterns" : [
        {
            "es": {
                "default_index": "logstash-*"
            },
            "tail_interval_in_seconds": 10,
            "es_index_time_offset_in_seconds": 0,
            "display_timezone": "local",
            "display_timestamp_format": "MMM DD HH:mm:ss",
            "max_buckets": 500,
            "default_time_range_in_days" : 0,
            "max_hosts": 100,
            "max_events_to_keep_in_viewer": 5000,
            "fields" : {
                "mapping" : {
                    "timestamp" : "@timestamp",
                    "hostname" : "kubernetes.host",
                    "program": "kubernetes.pod_name",
                    "message": "log"
                },
                "message_format": "{{{log}}}"
            },
            "color_mapping" : {
            }
        }]
    }
---
apiVersion: apps/v1beta1
kind: Deployment
metadata:
  name: kibana
  labels:
    component: kibana
spec:
  replicas: 1
  selector:
    matchLabels:
     component: kibana
  template:
    metadata:
      labels:
        component: kibana
    spec:
      containers:
      - name: kibana
        image: sh4d1/kibana-logtrail:6.2.4 # or your image
        volumeMounts:
          - name: logtrail-config
            mountPath: /config
        env:
        - name: CLUSTER_NAME
          value: myesdb # the name of your ES cluster
        resources:
          limits:
            cpu: 1000m
          requests:
            cpu: 100m
        ports:
        - containerPort: 5601
          name: http
      volumes:
        - name: logtrail-config
          configMap:
            name: logtrail-config
So let’s take look at Logtrail’s configuration. The first point is the default-index; it must be set to the index used by Elasticsearch.
Then the important part is the fields section. It will display like:
timestamp hostname program:message
The message is defined in message_format. We could put something like {{{docker.container_id}}}: {{{log}}}.
For further configuration you can check the repository of sivasamyk.
If you have any questions feel free to send me a email or contact me on the Docker Slack community @Sh4d1
kubernetes k8s efk elasticsearch fluentd kibana
1449 Words
2018-05-14 00:00 (Last updated: 2021-05-02 20:49)
a5cb94c @ 2021-05-02